Scientific Results obtained with DISR instrument
Geophysical Processes
![]()
Perspective view of the high plateau located 5 km to the north of the landing site. The greyscale and false colour model shows the altitude (the highest altitudes are the lightest). The region, which covers approximately 1x3 km, includes a network of branched channels on the high plateau and a section of the dried-up lake (in blue). The stereographic analysis indicates that the channels are approximately 200m and a depth of 100m with slopes reaching 30° in some places, close to the angle of repose. Rapid flows probably created these deeply carved valleys, with erosion due to sudden landslides on their slopes (Tomasko et al, 2005).
The spectacular images taken with DISR's cameras show a clear plateau with a large number of channels cut into it, which form drainage networks. The narrow channels converge into broad rivers, which drain into a dark expanse below. The river beds are approximately 100m deep and their slopes approach 30°, which suggests rapid erosion due to violent flows. Close to the landing site, located in this darker region, traces of past flows can also be seen. The site itself is reminiscent of a dried-up river bed, with rounded pebbles, 10 to 15cm in diameter, probably made of water ice, resting on a darker granular substrate. There is little doubt that it was the liquid methane that carved these channels and shaped these landscapes, but the frequency of the precipitations that created the networks remains an open question. The dark material that covers the vast darker expanse may have been carried along by the flows and could be made up of photochemical deposits. The geophysical processes that formed these structures seem similar to those at work on Earth, even if the chemical actors are different, with water ice on Titan playing the role of rock on Earth and methane the role of water.
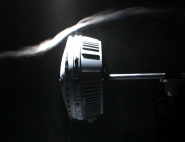
Wind profile
![]()
Image of Titan's surface taken by DISR after landing. It is possible to make out water ice pebbles of 10 to 15 cm, resting on a substrate of finer grains (Tomasko et al. 2005). Copyright: ESA/NASA/ Univ. Arizona
The assembly of panoramic mosaics by DISR provides a descent trajectory as an element of the iterative process of image reconstruction. This trajectory makes it possible to determine the probe's tracks on the ground and to extrapolate the wind speed according to the altitude. The probe first drifted east, driven by west (prograde) winds, weakening from 30 to 10 m/s between 55 and 30 km to reach 4 m/s at 20 km. This provides in situ confirmation of the superrotation of the atmosphere, predicted by the general circulation models for Titan, even though the speed observed is slightly lower. At around 7 km, near the expected summit of the outer atmospheric layer, the wind became almost nil. Lower down, the probe changed direction, moving west at a speed of approximately 1 m/s at around 4 km of altitude. We believe that the wind speed on the surface was between 0.3 and 1 m/s.
Structure of the mist
![]()
"Colored" panorama of Titan's surface composed of images taken between 17 and 8 km by the DISR instrument. Copyright : ESA/NASA/ Univ. Arizona
The combination of measurements taken by DISR throughout the descent made it possible to characterise the optical properties of the photochemical aerosols from 150 km altitude to the surface. They are aggregates composed of several thousand monomers, the size of the monomers not exceeding 0.05 micrometres. There are around 5 per cm³ at 80 km of altitude. Higher up, their density decreases, but less quickly than that of the gas, which indicates that they are formed in the upper atmosphere. Their optical properties are similar to 'tholins', materials created in laboratories through plasma discharge into mixtures of nitrogen and methane. The aerosols absorb and diffuse blue for preference, which explains the orange colour of Titan. Below 80 km, the optical properties of the aerosols change slightly. Around 30 km, the particles are larger and brighter, possibly because they now incorporate methane, whereas for the first few kilometres, their reflectivity is reduced, which could be due to the evaporation of part of this methane.
Methane absorption
![]()
![]()
Spectra recorded by the ULIS (upward looking) and DLIS (downward looking) sub-instruments of DISR at different altitudes. The measurements are distributed more or less randomly at azimuth. The sunlight is increasingly absorbed in the methane bands during the descent, while the spectral windows around 930, 1070, 1290 and 1580 nm remain fairly transparent (Tomasko et al. 2008c).
The infrared spectra recorded by DISR looking towards the sun measure the growth in methane absorption during the descent. Thanks to a precise reconstruction of the probe's descent profile (azimuth and altitude over time) it was possible to deduce from the DISR measurements the absorption coefficients for methane at a wavelength of 0.8 to 1.5 microns in Titan's atmosphere. This delicate work will be extremely useful, in particular for analysing the spectra recorded at a distance by the VIMS instrument on board Cassini. An interesting result is that the coefficients used to date appear unsuitable for modelling Titan's spectrum - and those of other planets such as Uranus and Neptune - since they are derived from laboratory measurements taken under very different travel, pressure and temperature conditions from those prevailing on Titan.
Abundance of methane near the surface and surface reflectivity
![]()
Surface reflectivity deduced from the spectrum recorded with the lamp at 25 m of altitude above the Huygens landing site, after correction for methane absorption (dotted line) and obtained after landing (solid line). The surface is relatively dark and shows high absorption around 1.5 microns, probably due to the water ice. Moreover, reflectivity decreases continuously from 0.8 to 1.5 micron, which has not yet been explained. (Jacquemart et al. 2008).
Thanks to its surface lamp, DISR obtained, at an altitude of 25m, a reflectivity spectrum of the surface, on which the methane absorption bands are superposed. Using new laboratory measures in conditions close to that of this spectrum with the lamp, it was possible to precisely determine the abundance of methane on the surface (5.1%), which corresponds to a humidity of close to 50%. As for the reflectivity of the surface, it is greatest in the red, at a wavelength of around 0.8 microns, and is reminiscent, in the visible domain, of that of the 'tholins' mentioned above. In the infrared we can observe absorption due to water ice at a wavelength of 1.54 microns, but the most unexpected characteristic is a regular decrease of reflectivity from 0.8 to 1.5 microns. This remains unexplained to date, and works are underway to evaluate whether mixtures of ice and certain organic compounds might reproduce these spectral characteristics.
Radiative budget of the atmosphere
![]()
Transmission from Titan's atmosphere, due solely to the methane, according to the altitude in the direction of the Sun at different wavelengths (symbols). The data is adjusted by exponential amounts at each wavelength sampled by the instrument (solid lines). The tables of coefficients obtained in this way make it possible to better model the atmospheric absorption at the spectral resolution of DISR (around 17 nm). (Tomasko et al, 2008a).
The visible and infrared spectra collected by DISR throughout the descent made it possible to determine the absorption of the solar flux (by the methane and aerosols) and therefore the rate of solar heating by altitude. This could be compared with the radiative cooling rate, calculated using the thermal emission spectra recorded by the CIRS instrument on board Cassini. In fact, based on spectra recorded at the limb and the nadir towards the same latitude (10°S), it was possible to determine vertical profiles of gas abundance and aerosol opacity, thereby calculating the thermal flux by altitude, and deduce from this the radiative cooling rate. The radiative heating rate exceeds the cooling rate with a maximum difference around 120 km. The general circulation probably redistributes this excess heat towards the higher latitudes. This work, which provides a precise radiative assessment for a given latitude and season, makes it possible to better understand the general circulation models for the atmosphere as currently developed.