Scientific Results obtained with CIRS instrument
Titan's seasonal change
![]()
Titan's changing seasons - credit: ESA/AOES
Saturn's moon Titan has a nitrogen atmosphere comparable to Earth's, with a surface pressure of 1.4 bar. Numerical models reproduce the tropospheric conditions very well but have trouble explaining the observed middle-atmosphere temperatures, composition and winds. The top of the middle-atmosphere circulation has been thought to lie at an altitude of 450 to 500 kilometres, where there is a layer of haze that appears to be separated from the main haze deck. This 'detached' haze was previously explained as being due to the co-location of peak haze production and the limit of dynamical transport by the circulation's upper branch. Here we report a build-up of trace gases over the south pole approximately two years after observing the 2009 post-equinox circulation reversal, from which we conclude that middle-atmosphere circulation must extend to an altitude of at least 600 kilometres. The primary drivers of this circulation are summer-hemisphere heating of haze by absorption of solar radiation and winter-hemisphere cooling due to infrared emission by haze and trace gases; our results therefore imply that these effects are important well into the thermosphere (altitudes higher than 500 kilometres). This requires both active upper-atmosphere chemistry, consistent with the detection of high-complexity molecules and ions at altitudes greater than 950 kilometres, and an alternative explanation for the detached haze, such as a transition in haze particle growth from monomers to fractal structures.
The moon Iapetus
![]()
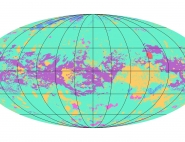
Surface map of Iapetus obtained using CIRS on 31 December 2004:
the orange asterisk marks the spot on the surface where the sun is at the vertical.
The surface of Iapetus (diameter ~ 1450 km) is characterised by zones with very different albedos. Very dark regions alternate with reflective regions. During the local midday, in the dark zones near the equator, the temperature reaches over 130°K ( 140°C). It is probably one of the hottest places within the Saturnian system, outside the atmospheres of Saturn and Titan. In comparison, the maximum temperature observed on the moon Phoebe is only 112°K (-160°C). Even though it is just as dark as the dark material on the surface of Iapetus, Phoebe turns much more quickly on its axis (in 9 hours instead of 79 days), which thus reduces the amount to which the Sun can heat the surface. In contrast, the temperature of the reflective zones on Iapetus is around 100°K ( 170°C), due to the lower absorption of sunlight, and also because these zones are located at higher latitudes, where the rays of the sun are more slanted.
The moon Enceladus
![]()
Surface temperature close to the South Pole of Enceladus: a visible image and an infrared CIRS image are superposed in the figure. The brighter zones in the infrared are the hottest (around 90°K) and correspond to fractures through which gas and ice particles escape as geysers.
Despite its small size, Enceladus (diameter~500 km) is the site of spectacular phenomena. Geysers of ice and gas were observed by Cassini's cameras in the immediate vicinity of the South Pole. CIRS was able to chart the surface temperature in that specific zone. These measurements reveal stripes that are far hotter than the surrounding zones (90°K on average across the width of the stripes, instead of 75-80°K). These stripes correspond to crevasses through which the geysers escape. Given the shape of the thermal phenomenon and according to the hypotheses on the actual width of the geyser emission zone (between 50 and 600 m), their temperature is estimated at 135-180°K. This abnormal temperature, hotter than the sunlight alone would be expected to produce, shows that there is an internal heat source, of as yet undetermined origin. The most likely hypothesis is an internal heating of the moon due to tidal effects, which would lead to the formation of pockets of liquid water under pressure, giving rise to the geysers observed.
Saturn's rings
![]()
Temperature of the rings: The four images show the temperature measured by CIRS on the bright or dark sides of the rings, while observing both the day and the night side of the particles
CIRS also measures the temperature of the rings. The rings are confined to the equatorial plane and are very thin, only a few tens of metres thick. The instrument observes the bright side of the rings, but also the side facing away from the Sun, which is impossible from Earth. While orbiting Saturn, CIRS can also observe with different phase angles, that is, it can look at the day or the night side of the particles that make up the rings. These measurements together make it possible to determine the thickness of the rings, but also the size of the particles, their speed of rotation, and their organisation within the rings.
Saturn's atmosphere: the polar regions
![]()
Temperature charts in the upper troposphere (150 mbar) and in the stratosphere (1 mbar) of Saturn at the North (figures A and B) and South Poles (figures C and D).
Saturn's polar regions are highly dissimilar from a thermal point of view. The North Pole is barely emerging from a winter that has lasted over 7 years (between the beginning of 2002 and mid 2009). In the stratospheric zones, which are the most sensitive to heating by solar radiation, an average difference between the North and South poles can be measured at over 30°K at 1 mbar, whereas at 150 mbar, the difference is only 20°K or so. At the tropospheric level, the two poles are characterised by hot spots centred on the poles, themselves surrounded by hexagonal vortices that are observable in the visible spectrum as well. At lower latitudes, the familiar structure of bands and zones is also present.
Saturn's atmosphere: an abundance of ethane (C2H6) and acetylene (C2H2)
![]()
Ethane and acetylene: Variation by latitude of the abundance of ethane and acetylene on Saturn. The maximum at 30°N is due to the atmospheric circulation.
In Saturn's atmosphere, CIRS was also able to map the abundance of ethane (C2H6) and acetylene (C2H2). These measurements show an atmospheric circulation that transports air rich in hydrocarbons from the southern to the northern hemisphere. The enriched air descends in the zone where the ring's shadow is located, a zone that receives no solar radiation throughout the winter season.
Titan's atmosphere
![]()
Titan's spectrum, observed by CIRS, shows a number of molecular lines, which make it possible to measure the temperature and chemical composition of the moon's atmosphere.
![]()
The latitudinal distribution of certain minority compounds in Titan's atmosphere, in particular C3H8, C4H2, HCN and HC3N, varies markedly according to the latitude.
CIRS makes it possible to detect and measure various types of molecules within Titan's atmosphere. The majority of these molecules are produced by the combined photochemistry of methane (CH4) and nitrogen (N2), which produce hydrocarbons and complex nitriles. Carbon dioxide (CO2), meanwhile, is largely external in origin.
The cartography of the temperature and gas composition fields makes it possible to trace the atmospheric circulation. This shows itself mainly through zonal winds (at constant latitude) in the stratosphere, at an altitude of around 200 km, but there is also a minor component of meridional circulation (at constant longitude) in the troposphere, or below 40 km.
On the other hand, the concentration of certain minority compounds - particularly C3H8, C4H2, HCN and HC3N - increases markedly towards the North Pole, a characteristic already observed by the Voyager 1 probe when it passed by in 1980. This phenomenon is the result of a polar vortex (a zone that is dynamically isolated from the rest of the atmosphere), which forms during the winter season. The molecules most vulnerable to photodissociation due to solar UV radiation accumulate within the vortex without being diluted in the rest of the atmosphere. It is a very similar situation to that observed on Earth above the Antarctic continent, where the accumulation of chlorofluorocarbons (CFCs) during the southern winter leads to the destruction of the ozone layer in the following spring. In the next few years, until the summer solstice of the Northern hemisphere in 2017, the situation is expected to reverse, to end in the formation of a polar vortex in the South and a reversal of the concentration profiles of photosensitive molecules, which will then be concentrated in the South.